NetworkX is not powerful enough to draw large graphs since it only provides basic functionality for visualizing graphs. This article presents a better way to visualize graphs, i.e. using layouts in Gephi.
Step 1. Export NetworkX graphs into a proper format
Export NetworkX graphs into a format that can be read by Gephi, such as .gramph. nx.write_graphml writes a graph in GraphML XML format. For instance,
filename = 'paris_gtfs_graph.graphml'
nx.write_graphml(G, filename)
Step 2. Layout in Gephi
Open the graph file in Gephi, run an appropriate layout (I usually use YifanHu. Drag nodes manually if necessary) and save as a new graph file as depicated in the following figure.
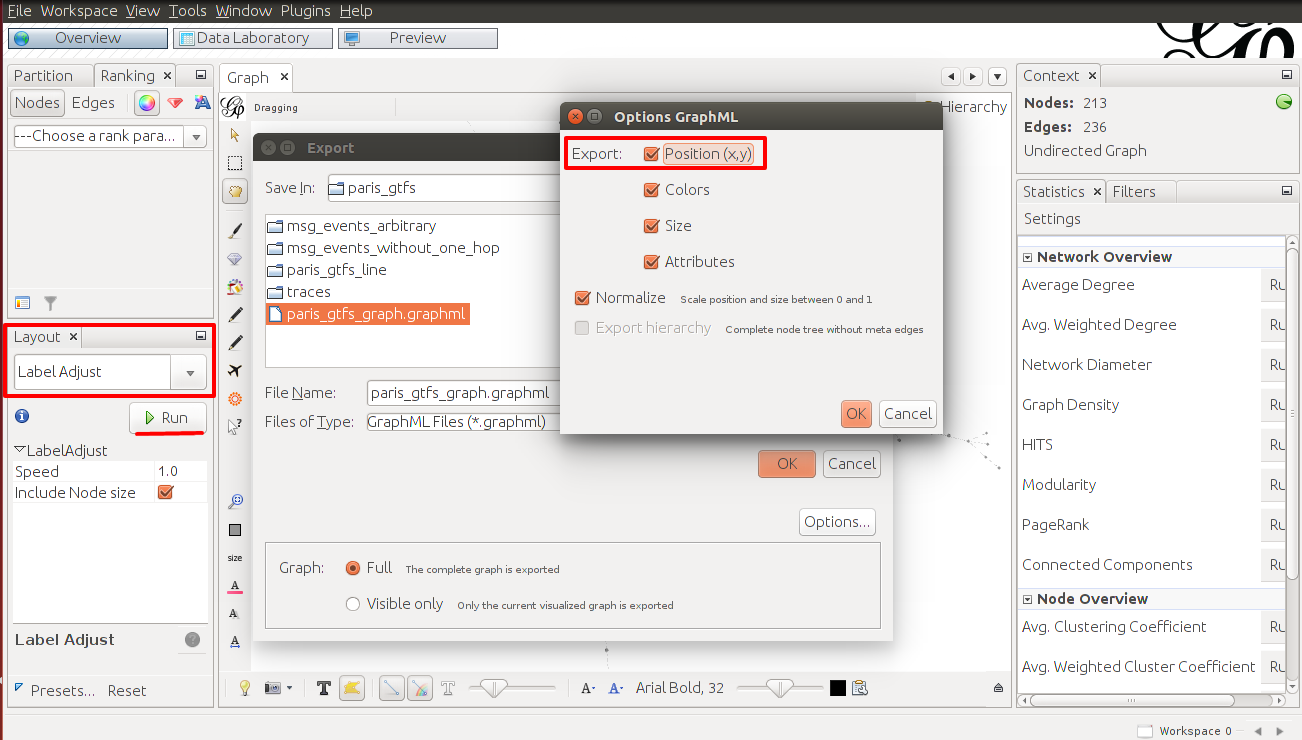
Fig. 1: Run layout and save as a new file in Gephi
Step 3. Plot with Matplotlib
Read a graph in GraphML format with position, using read_graphml(path, node_type=<type 'str'>),
@classmethod
def read_graphml_with_position(cls, filename):
    """Read a graph in GraphML format with position
    """
    G = nx.read_graphml(filename)

    # rearrage node attributes x, y as position for networkx
    pos = dict() # A dictionary with nodes as keys and positions as values. Positions should be sequences of length 2.
    node_and_x = nx.get_node_attributes(G, 'x')
    node_and_y = nx.get_node_attributes(G, 'y')

    for node in node_and_x:
        x = node_and_x[node]
        y = node_and_y[node]
        pos[node] = (x, y)

    # add node attribute `pos` to G
    nx.set_node_attributes(G, 'pos', pos)

    return G
Draw graphs with NetworkX.
@classmethod
def plot_graph(cls, G, filename=None, node_attribute_name='id', edge_attribute_name=None,
                colored_nodes=None, colored_edges=None, colored_path=None, **kwargs):
#def plot_graph(self, G, out_file, **kwd):
    """plot graph"""
    plt.clf()

    # get the layout of G
    pos = nx.get_node_attributes(G, 'pos')
    if not pos:
        pos = nx.spring_layout(G)

    # get node attributes
    with_labels = False
    node_labels = None
    if node_attribute_name == 'id':
        with_labels = True
    elif node_attribute_name:
        node_labels = nx.get_node_attributes(G, node_attribute_name)

    # get edge attributes
    if not edge_attribute_name:
        edge_labels = nx.get_edge_attributes(G, edge_attribute_name)

    # colored nodes
    node_default_color = '0.75' # Gray shades

    node_color = node_default_color
    if colored_nodes:
        node_color = ['r' if node in colored_nodes else node_default_color
                        for node in G.nodes()]

    # colored path
    if colored_path:
        nrof_nodes = len(colored_path)
        idx = 0
        colored_edges = list()
        while idx < nrof_nodes-1:
            colored_edges.append((colored_path[idx], colored_path[idx+1]))
            idx += 1

    # colored edges
    edge_default_color = 'k' # black
    edge_color = edge_default_color
    if colored_edges:
        set_colored_edges = {frozenset(t) for t in colored_edges}  # G.edges returns a list of 2-tuples

        edge_color = ['r' if frozenset([u, v]) in set_colored_edges else edge_default_color
                        for u, v in G.edges()]


    # draw
    nx.draw(G, pos, with_labels=with_labels, node_color=node_color, edge_color=edge_color, **kwargs)
    if node_labels:
        nx.draw_networkx_labels(G, pos, labels=node_labels)
    nx.draw_networkx_edge_labels(G, pos, edge_labels=edge_labels)

    if filename:
        plt.savefig(filename, bbox_inches='tight', pad_inches=0)
    else:
        plt.show()
Below is a graph drawn with Gephi.
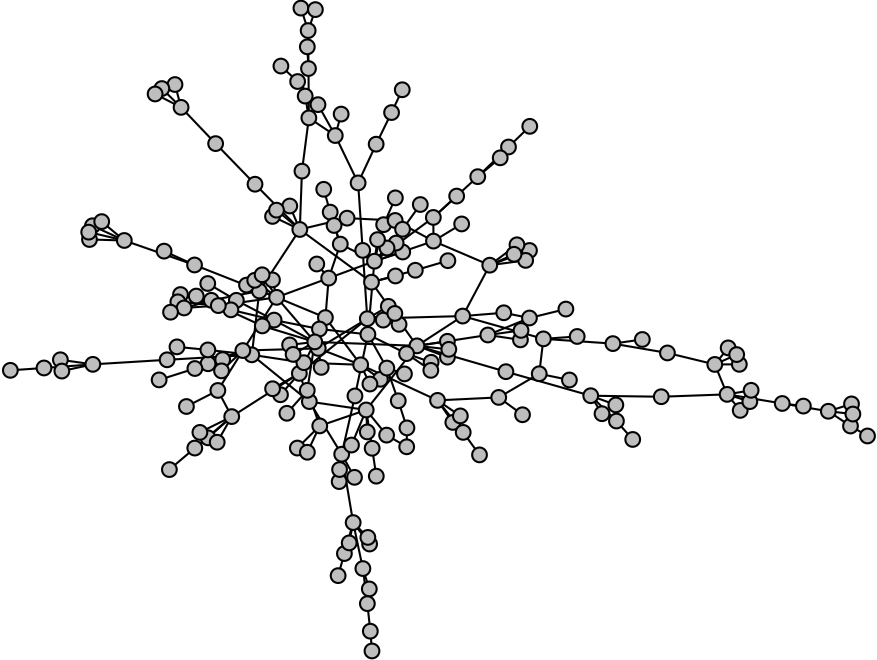
Fig. 2: A NetworkX graph is drawn using layouts provided by Gephi
PS: The source code is shared on my GitHub, graphviz.py and draw_networkx_graphs_with_gephi.py.
Appendix: GraphML
networkx supports a wide range of import and export formats, such as GraphML. The exported file GraphML can be easily loaded into Gephi and visualised there.
GraphML is an XML-based file format for graphs). The GraphML file format results from the joint effort of the graph drawing community to define a common format for exchanging graph structure data. It uses an XML-based syntax and supports the entire range of possible graph structure constellations including directed, undirected, mixed graphs, hypergraphs, and application-specific attributes.
Part of an example of GraphML,
<?xml version="1.0" encoding="UTF-8"?>
<graphml xmlns="http://graphml.graphdrawing.org/xmlns">
<key attr.name="label" attr.type="string" for="node" id="label"/>
<key attr.name="Edge Label" attr.type="string" for="edge" id="edgelabel"/>
<key attr.name="weight" attr.type="double" for="edge" id="weight"/>
<key attr.name="Edge Id" attr.type="string" for="edge" id="edgeid"/>
<key attr.name="r" attr.type="int" for="node" id="r"/>
<key attr.name="g" attr.type="int" for="node" id="g"/>
<key attr.name="b" attr.type="int" for="node" id="b"/>
<key attr.name="x" attr.type="float" for="node" id="x"/>
<key attr.name="y" attr.type="float" for="node" id="y"/>
<key attr.name="size" attr.type="float" for="node" id="size"/>
<key attr.name="overlapping_time" attr.type="double" for="node" id="0"/>
<key attr.name="route" attr.type="string" for="edge" id="1"/>

<graph edgedefault="undirected">

<node id="3060">
<data key="label">3060</data>
<data key="0">0.0</data>
<data key="size">NaN</data>
<data key="r">153</data>
<data key="g">153</data>
<data key="b">153</data>
<data key="x">0.17934783</data>
<data key="y">0.6219646</data>
</node>

<edge source="3126" target="3064">
<data key="edgeid">105</data>
<data key="weight">1.0</data>
<data key="1">537</data>
</edge>

</graph>
</graphml>